AI STRATEGY RESEARCH
Test trading ideas with honest statistics
Describe a strategy in plain English. Quantis Trade backtests it on full daily histories of US, UK and European stocks and ETFs, with dividends, UK costs and your broker's fees, and shows you how far to trust the result.
Verify your email to get 3 free tests (1,000 tokens) · No card needed
Strategy Engine
Your idea, tested honestly.
From a plain-English description to a backtest with its assumptions, costs, caveats and stability check attached.
An example of what you type
Strategy agent · plain English in, backtest out
What a result shows
SPY (SPDR S&P 500 ETF)
Tested period
The window you ask for
Daily bars
50/200-day moving-average crossover
Equity curve vs buy-and-hold
Performance
CAGR
Average yearly growth
SHARPE
Return per unit of risk
SORTINO
Same, counting only downside
MAX DD
Worst peak-to-trough fall
HIT RATE
Share of days in the market that ended up
PSR / DSR
How firmly the Sharpe stands above luck
COSTS
Fees, stamp duty and UK broker presets
ALPHA / BETA
Return beyond the market, and market exposure
Time-Slice Stability
Rolling windowsEARLIER-SLICE SHARPE
Sharpe over the earlier part of each window
LATER-SLICE SHARPE
Sharpe over the later part of each window
SHARPE CHANGE
A big drop between slices is flagged
Built for everyone
Whether it's your first strategy or your hundredth
One workspace for both: plain-English explanations for newcomers, the full statistics for quants.
Find out if an idea holds up
No coding needed. Describe a strategy in plain English, see how it would have done on real historical data, and get every metric explained in plain words.
- Plain-English strategy builder
- Test at your own amount, with your UK broker's fees
- Warnings when a result is too thin to trust, or could be luck
- Paper trading with no real money at risk
- Education Centre that explains the statistics
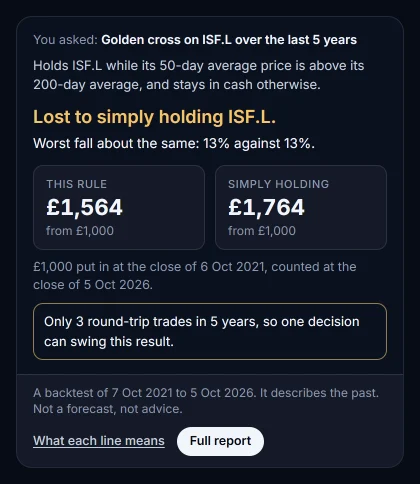
Methodology you can check
Probabilistic and deflated Sharpe, time-slice stability and the Sharpe of every pair of sub-periods (fixed parameters, nothing re-fitted), and Monte Carlo. Thresholds and assumptions are stated, not hidden.
- Deflated Sharpe counted over every test of the idea
- Time-slice stability and the Sharpe across sub-periods
- Total return, with costs and taxes from the engine's own report
- Reproduce download, public evidence explorer and an MCP server
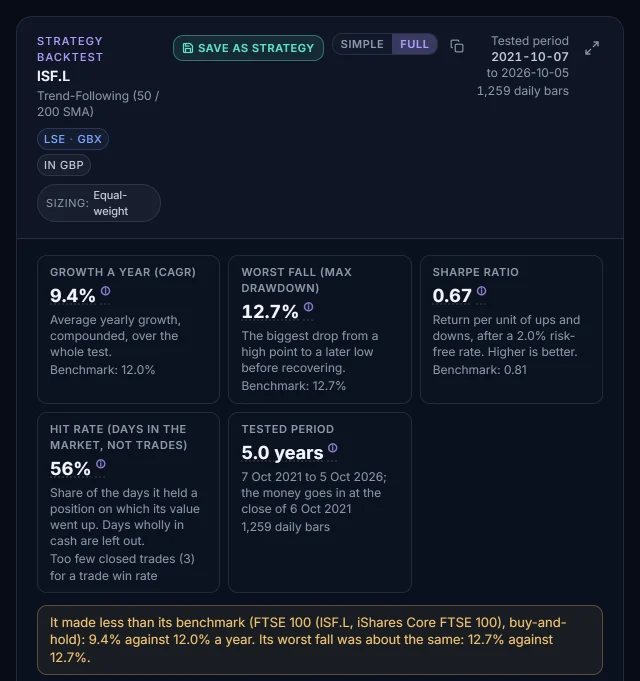
Research, build and paper trade in one place
No black boxes. Every result shows the rules it ran and the assumptions behind it.
Research
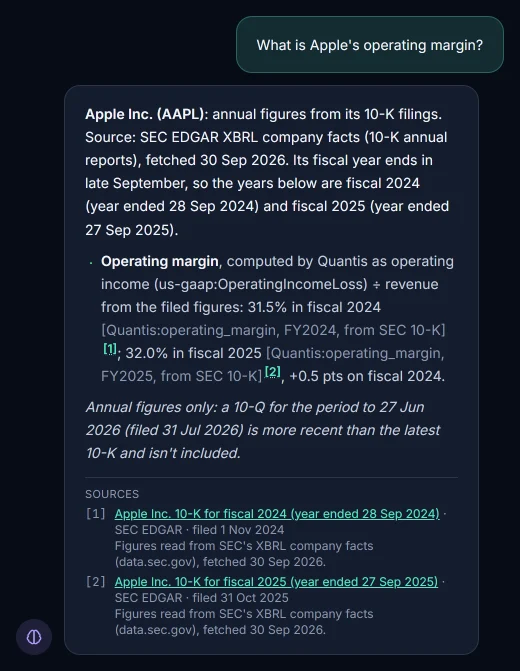
Ask questions in plain English and get answers from real data.
Prices, company fundamentals and FRED macro data
Every figure linked to its source, with a date
Says so when a question is out of scope
Strategy builder
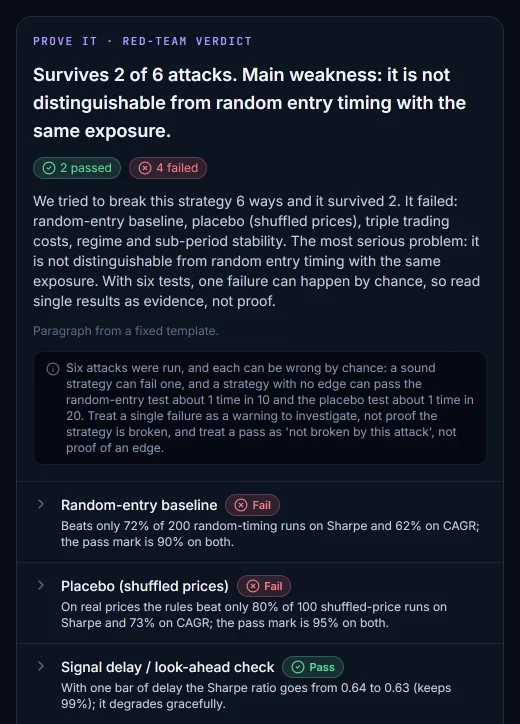
Turn an idea into a backtest, with or without code.
Combine up to four conditions; the engine runs exactly what you asked
Full daily histories, total return, cost shown before you run
Or set a goal and see every candidate judged on held-out years
Only shares and funds that trade today are in the data. A company that failed, was taken over or was delisted is not in it.
Paper trading
Practise before you risk anything.
A strategy you track follows its backtest exactly: weights, timing, costs
Publish it for a locked forward track record
Real-money trading isn't available (there's a waitlist)
Frequently asked questions
Straight answers about what Quantis Trade does, and what it doesn't.
Do I need any coding experience?+
No. Describe a strategy in plain English and the strategy agent turns it into rules and backtests them. The result shows the rules it actually ran, so you can check it understood you.
What data do backtests use?+
Daily price bars for US-listed stocks and ETFs, and for UK, European and Swiss listings: FTSE 100 and some FTSE 250 shares, UK ETFs, large Euro Stoxx 50 stocks and Swiss majors. Only shares and funds that trade today are in the data. A company that failed, was taken over or was delisted is not in it. So a test that picks from a list of shares is flattered, by an amount the test cannot measure. Each backtest uses one currency and is total return by default: dividends are reinvested after a UK investor's default withholding tax, and UK stamp duty is charged on purchases of UK shares. US company fundamentals and FRED macro series are used where a strategy needs them. There is no intraday, options, futures or crypto data. If you ask for something outside that coverage, you get a clear error rather than a different strategy.
Counting the shares and funds with daily prices.
Can I trade live or connect a broker?+
Not with real money. Quantis Trade is for research, backtesting and paper trading, and real-money trading is on a waitlist. Practice accounts at a broker, which hold pretend money, are being tested and are not open to every account yet.
Can I test with my own amount and broker?+
Yes. Say how much you would put in and which broker you use, for example "I have £500 on Trading 212", and the backtest runs at that amount with that broker's dealing charges, FX fee and share rules. There are presets for five UK brokers, or you can enter your own fees. The result shows the smallest amount from which the fees stop mattering much.
How does paper trading work?+
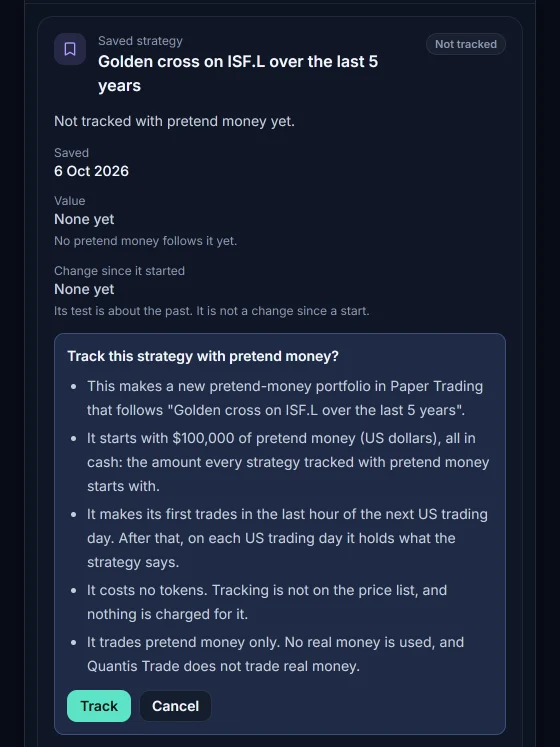
Deploy a saved strategy to paper trading and it holds the same target weights the backtest engine chose, on the strategy's own rebalance days, with the backtest's costs, dividends and interest on idle cash. You can also place your own paper trades, filled against market prices. Paper trading covers US listings for now. Results are a simulation and won't exactly match what a broker would have filled.
Is Quantis Trade financial advice?+
No. Quantis Trade shows how a rule would have done on past prices. It doesn't tell you what to buy, and a good backtest doesn't mean the rule will work in future. Please read our risk warning at /risk-warning before acting on any result.
How are tokens consumed?+
Every test costs 300 tokens, whatever its length and however many shares it covers. Research questions and the other tools are paid for in the same tokens and have their own prices. The strategy and research agents show the cost before you run anything. New accounts: verify your email to get 3 free tests (1,000 tokens), one free trial per email inbox. The 3 tests use 900 tokens and the other 100 pay for research questions.
Is my work private?+
Your strategies, backtests and research are tied to your account and aren't shown to other users unless you choose to share them, with a share link or on the community feed.
Start today
Test it before you trust it.
Find out whether a strategy holds up on historical data, and how much of the result could be luck, before you put money behind it.
Verify your email to get 3 free tests (1,000 tokens). No card needed.